

Nhằm giúp các bạn thí sinh ôn tập tốt cho phần thi IELTS Writing, TutorIn Education đã sưu tầm một số bài mẫu IELTS Writing Task 1 dạng Bar chart. Hãy cùng phân tích và nghiên cứu cách viết của một bài mẫu đạt điểm cao nhé!
Đề bài IELTS Writing Task 1 dạng Bar chart
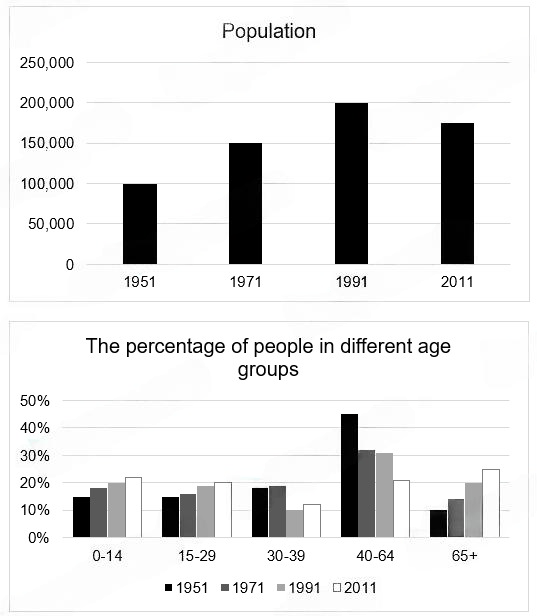
The bar charts below show the information about the population in a particular town in the UK from 1951 to 2011. Summarise the information by selecting and reporting the main features, and make comparisons where relevant.
Write at least 150 words.
Bài viết mẫu IELTS Writing Task 1 dạng Bar chart
Introduction
The first bar chart illustrates how many people lived in a certain British town between 1951 and 2011, while the second depicts how the proportion of residents from five various age groups changed during the same period.
Overall
Overall, there was an increase in the total population of this place, despite a downward trend in the percentage of 30-64-year-olds.
Body paragraph 1
In terms of the total population, the number was 100,000 in 1951. After that, it doubled, reaching 200,000 in 1991 before dropping slightly to approximately 175,000 in 2011.
Body paragraph 2
Turning to the percentage of people of different ages, those under 15 and those between 15 and 29 accounted for 15% each. Following this, the figures grew gradually to roughly 22% and 20% in 2011 respectively. Likewise, the proportion of senior citizens aged 65 and over also increased, but rapidly from 10% in 1951 to 25% in 2011.In contrast, 30-39-year-old people represented around 18% in 1951 and some 19% in 1971. However, the figure had almost halved to 12% by 2011. Although the percentage of 40-64-year-olds was by far the highest, at 45%, it dropped to just over 30% in 1991 and 20% in 2011.
Từ vựng tích lũy
| Từ, cụm từ | Nghĩa | Ví dụ |
| illustrates | minh họa | The first bar chart illustrates how many people lived… |
| depicts | miêu tả | …while the second depicts how the proportion of residents… |
| Overall | Nhìn chung | Overall, there was an increase in the total population… |
| despite a downward trend | mặc dù có xu hướng giảm | …despite a downward trend in the percentage of 30-64-year-olds. |
| In terms of | Về mặt | In terms of the total population, the number was… |
| doubled | tăng gấp đôi | After that, it doubled, reaching 200,000 in 1991… |
| dropping slightly to | giảm nhẹ xuống | …before dropping slightly to approximately 175,000 in 2011. |
| Turning to | Chuyển sang | Turning to the percentage of people of different ages… |
| accounted for | chiếm | …those under 15 and those between 15 and 29 accounted for 15% each. |
| grew gradually | tăng dần | Following this, the figures grew gradually to roughly 22% and 20% in 2011 respectively. |
| senior citizens | người cao tuổi | …the proportion of senior citizens aged 65 and over also increased… |
| rapidly | nhanh chóng | …but rapidly from 10% in 1951 to 25% in 2011. |
| In contrast | Ngược lại | In contrast, 30-39-year-old people represented around 18% in 1951… |
| by far the highest | cao nhất cho đến nay | Although the percentage of 40-64-year-olds was by far the highest… |
| dropped to just over | giảm xuống chỉ còn hơn | …it dropped to just over 30% in 1991 and 20% in 2011. |
Hãy lưu lại những từ vựng được tổng hợp bởi TutorIn Education để chuẩn bị cho kỳ thi IELTS của bạn nhé. Bạn muốn tăng điểm IELTS nhanh chóng, đừng quên tham khảo thêm các bài viết khác từ TutorIn:


