

Nhằm giúp các bạn thí sinh ôn tập tốt cho phần thi IELTS Writing, TutorIn Education đã sưu tầm một số bài mẫu IELTS Writing Task 1 dạng Bar chart. Hãy cùng phân tích và nghiên cứu cách viết của một bài mẫu đạt điểm cao nhé!
Đề bài IELTS Writing Task 1 dạng Bar chart
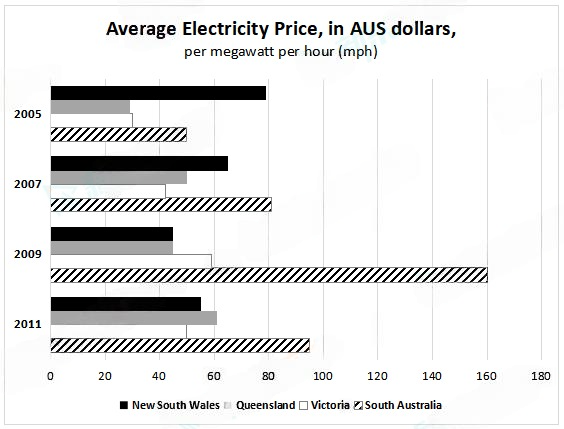
The chart below shows the average electricity price in Australia from 2005 to 2011. Summarise the information by selecting and reporting the main features, and make comparisons where relevant.
Write at least 150 words.
Bài viết mẫu IELTS Writing Task 1 dạng Bar chart
Introduction
The bar chart illustrates changes in the electricity rates in four states in Australia: New South Wales (NSW), Queensland (QLD), Victoria (VIC) and South Australia (SA) between 2005 and 2011.
Overall
Overall, there was a rise in how much people paid for electricity in all states, expect NSW which recorded a drop.
Body paragraph 1
For NSW and VIC, NSW in 2005 had by far the highest rate of these states, with residents charged approximately AU$80 per megawatt per hour. The figure then decreased noticeably to around AU$45 in 2009 but had increased slightly to about AU$55 by 2011. In contrast, in VIC the price was some AU$30 initially, and after that, it had almost doubled by 2009 before dipping to around AU$50 in 2011.
Body paragraph 2
Regarding the other two jurisdictions, Queenslanders enjoyed the lowest rate in 2005, at about AU$29, which was around AU$20 lower than that in SA, at AU$50. During the entire period, the rate in QLD experienced a fluctuation, at around AU$50 in 2007, AU$45 in 2009 and AU$60 in 2011, while the figure in SA in 2009 was twice higher than that in 2007, at AU$80 and AU$160 respectively. However, people in SA paid approximately AU$95 in the end.
Từ vựng tích lũy
| Từ, cụm từ | Nghĩa | Ví dụ |
| a rise in | sự tăng | there was a rise in how much people paid for electricity… |
| recorded a drop | ghi nhận sự giảm | except NSW which recorded a drop |
| by far the highest | cao nhất cho đến nay | NSW in 2005 had by far the highest rate of these states… |
| decreased noticeably | giảm đáng kể | The figure then decreased noticeably to around AU$45… |
| had almost doubled | đã gần như tăng gấp đôi | it had almost doubled by 2009… |
| dipping to | giảm xuống | before dipping to around AU$50 in 2011 |
| enjoyed the lowest rate | được hưởng mức giá thấp nhất | Queenslanders enjoyed the lowest rate in 2005, at about AU$29 |
| experienced a fluctuation | trải qua sự dao động | the rate in QLD experienced a fluctuation… |
| twice higher than | cao gấp đôi so với | in 2009 was twice higher than that in 2007… |
| in the end | cuối cùng | people in SA paid approximately AU$95 in the end |
Hãy lưu lại những từ vựng được tổng hợp bởi TutorIn Education để chuẩn bị cho kỳ thi IELTS của bạn nhé. Bạn muốn tăng điểm IELTS nhanh chóng, đừng quên tham khảo thêm các bài viết khác từ TutorIn:


